Please Note: This article is written for users of the following Microsoft Excel versions: 97, 2000, 2002, and 2003. If you are using a later version (Excel 2007 or later), this tip may not work for you. For a version of this tip written specifically for later versions of Excel, click here: Displaying Negative Times.
Written by Allen Wyatt (last updated October 4, 2025)
This tip applies to Excel 97, 2000, 2002, and 2003
Mike has a worksheet that contains some times. If he subtracts 6:33 from 6:21 he noticed that he doesn't get a negative elapsed time, as in -:12. Instead he gets ############# in the cell. Mike is wondering how he can display the negative time difference properly?
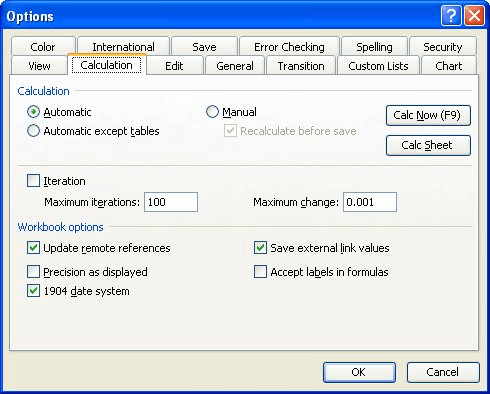
The easiest way to solve this problem is to just change the date system used by the workbook. This may sound goofy, but if you use a 1900 date system (which is the default for Windows versions of Excel), then you get the ############# in the cell. If, instead, you change to the 1904 date system (which is the default for Mac versions of Excel) then you'll see the correct negative elapsed time in your formula.
To change the date system, follow these steps:

Figure 1. The Calculation tab of the Options dialog box.
If you prefer to not change the dating system used in the workbook (perhaps it may mess up some other date formulas you have in the worksheet), then the only thing you can do is to create a text-based version of the time differential using a formula such as the following:
=IF(B2-A2<0, "-" & TEXT(ABS(B2-A2),"hh:mm"), B2-A2)
If the difference between the two time values (in A2 and B2) is negative, then the formula concatenates a text value consisting of the minus sign and the absolute value of the difference between the times.
ExcelTips is your source for cost-effective Microsoft Excel training. This tip (3514) applies to Microsoft Excel 97, 2000, 2002, and 2003. You can find a version of this tip for the ribbon interface of Excel (Excel 2007 and later) here: Displaying Negative Times.

Professional Development Guidance! Four world-class developers offer start-to-finish guidance for building powerful, robust, and secure applications with Excel. The authors show how to consistently make the right design decisions and make the most of Excel's powerful features. Check out Professional Excel Development today!
Want to know how much of a time difference there is between your machine and a different machine? This tip provides some ...
Discover MoreEnter information into a worksheet, and you come to anticipate (and count on) how Excel will interpret that information ...
Discover MoreExcel allows you to store dates in a cell. Wouldn't it be great if you could select a cell containing a date and then ...
Discover MoreFREE SERVICE: Get tips like this every week in ExcelTips, a free productivity newsletter. Enter your address and click "Subscribe."
There are currently no comments for this tip. (Be the first to leave your comment—just use the simple form above!)
Got a version of Excel that uses the menu interface (Excel 97, Excel 2000, Excel 2002, or Excel 2003)? This site is for you! If you use a later version of Excel, visit our ExcelTips site focusing on the ribbon interface.
FREE SERVICE: Get tips like this every week in ExcelTips, a free productivity newsletter. Enter your address and click "Subscribe."
Copyright © 2026 Sharon Parq Associates, Inc.
Comments