Please Note: This article is written for users of the following Microsoft Excel versions: 97, 2000, 2002, and 2003. If you are using a later version (Excel 2007 or later), this tip may not work for you. For a version of this tip written specifically for later versions of Excel, click here: Printing a Chart.
Written by Allen Wyatt (last updated March 7, 2020)
This tip applies to Excel 97, 2000, 2002, and 2003
Excel allows you to quickly convert your worksheet data into snazzy charts. (You know—a picture is worth a thousand worksheet cells.) Once your chart looks just the way you want it to, you may be wondering exactly how to get the best results when printing it. In many ways, printing a chart is the same as printing a worksheet, but with a few subtle differences.
If you are not printing to a color printer, the first thing you will want to do is make sure you use the Print Preview feature to see what your chart will appear like in black and white. If there is not enough contrast between different parts of your chart, you will want to make changes to either the colors or patterns used within the chart so there is a better contrast and your printed chart will look better.
When you are ready to print your chart, the easiest method is to simply press Ctrl+P. Excel displays the Print dialog box, with which you are probably already familiar. (See Figure 1.) The information at the top of the dialog box indicates where your chart will be printed. If this is not the printer you want to use, choose a different printer using the drop-down list.
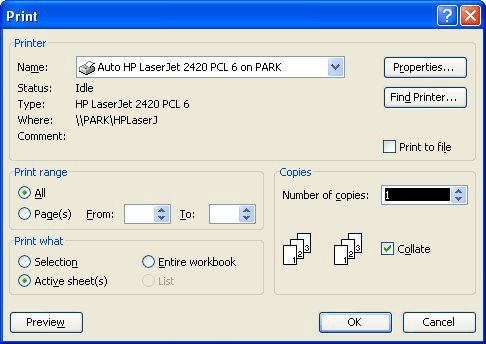
Figure 1. The Print dialog box.
The actual information and options available in the Print dialog box can vary depending on the type of printer you are using. Different printers have different capabilities, and Windows takes advantage of these capabilities as much as possible. In general, however, you can use this dialog box to select the number of copies you want to print, along with which pages you want to print.
One of the other things you can specify is what you want sent to the printer. This is done by making a selection in the Print What box. By default, this field is set to Active Sheet(s), typically meaning that only the current worksheet will be printed (the one containing your chart). By changing this field, you can also specify that only a Selection be printed or that your Entire Workbook is printed. (You should note that the Selection option will only be available if you are printing a worksheet containing an embedded chart; it is not available when printing a chart sheet.)
When you are satisfied with what you want to print, click on the OK button. Excel sends your information to the printer, as you have directed.
ExcelTips is your source for cost-effective Microsoft Excel training. This tip (3244) applies to Microsoft Excel 97, 2000, 2002, and 2003. You can find a version of this tip for the ribbon interface of Excel (Excel 2007 and later) here: Printing a Chart.

Solve Real Business Problems Master business modeling and analysis techniques with Excel and transform data into bottom-line results. This hands-on, scenario-focused guide shows you how to use the latest Excel tools to integrate data from multiple tables. Check out Microsoft Excel Data Analysis and Business Modeling today!
Text boxes are easy to add to a document and manually resize, as needed. If you want to resize the text box in a macro, ...
Discover MoreIf you want to enhance the appearance of a worksheet, one way to do it is to add a graphic. Excel allows you to add one ...
Discover MoreThe camera tool allows you to capture dynamic "pictures" of portions of a worksheet. If you want to use the camera tool ...
Discover MoreFREE SERVICE: Get tips like this every week in ExcelTips, a free productivity newsletter. Enter your address and click "Subscribe."
There are currently no comments for this tip. (Be the first to leave your comment—just use the simple form above!)
Got a version of Excel that uses the menu interface (Excel 97, Excel 2000, Excel 2002, or Excel 2003)? This site is for you! If you use a later version of Excel, visit our ExcelTips site focusing on the ribbon interface.
FREE SERVICE: Get tips like this every week in ExcelTips, a free productivity newsletter. Enter your address and click "Subscribe."
Copyright © 2026 Sharon Parq Associates, Inc.
 Please Note:
This article is written for users of the following Microsoft Excel versions: 97, 2000, 2002, and 2003. If you are using a later version (Excel 2007 or later), this tip may not work for you. For a version of this tip written specifically for later versions of Excel, click here:
Please Note:
This article is written for users of the following Microsoft Excel versions: 97, 2000, 2002, and 2003. If you are using a later version (Excel 2007 or later), this tip may not work for you. For a version of this tip written specifically for later versions of Excel, click here:
Comments