Please Note: This article is written for users of the following Microsoft Excel versions: 97, 2000, 2002, and 2003. If you are using a later version (Excel 2007 or later), this tip may not work for you. For a version of this tip written specifically for later versions of Excel, click here: Exploded Pie Chart Sections.

Exploded Pie Chart Sections

Written by Allen Wyatt (last updated October 14, 2023)
This tip applies to Excel 97, 2000, 2002, and 2003


Gloria asked if there was a way, in a 3-D pie chart, to "explode" groups of slices, instead of individual slices. When you pick an exploded pie chart as your chart type, all the slices of the pie are "pushed back," away from the center of the pie. Gloria was looking for a way to have different slices grouped together in the view.

There is no way to group individual slices of the pie prior to exploding, nor does Excel provide a way to push selected slices together. There are, however, a couple of workarounds that can be tried.

The first approach is to make a chart for every grouping in your original data. Each chart is based on the entire original data table, but you set the colors for the group to be represented by the particular chart, and then make the other groups "invisible" by turning off their borders and colors. You can then overlay the charts to get the desired effect. This approach obviously would require some experimentation to get exactly the right look, but it is a great approach if the data that underlies the table will change periodically.

Another approach is to treat your pie chart as a drawing object. This gives you a great deal of flexibility, and is most appropriate for "one up" charts that won't be later changed. Follow these general steps:

  1. Create an exploded pie chart based on your data, formatting the chart as desired. (Each slice should be exploded.)
  2. Select the chart by clicking on it.
  3. Hold down the Shift key as you select the Edit menu. (This affects the choices shown in the menu.)
  4. Choose Copy Picture from the menu. Excel displays the Copy Picture dialog box. (See Figure 1.)
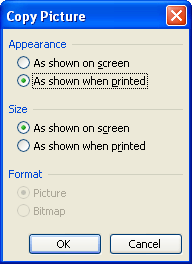
  5. Figure 1. The Copy Picture dialog box.

  6. Make sure the As Shown When Printed option is selected, then click on OK. The picture is now on the Clipboard.
  7. Display a blank worksheet.
  8. Press Ctrl+V. The chart is now displayed as a picture in the worksheet.
  9. Right-click on the picture. Excel displays a Context menu for the image.
  10. Choose Grouping, then Ungroup. Excel asks if you want to convert the picture to a Microsoft Office drawing object.
  11. Click on Yes. The image is converted, and every item in the chart is now selected.
  12. Individually select and delete any items you don't want kept.
  13. Select and move the various parts of the pie chart, as desired. (Excel considers each panel of a 3-D slice to be an object. Thus, if you want to move a slice, you need to select the top and sides and move them together.)

ExcelTips is your source for cost-effective Microsoft Excel training. This tip (2825) applies to Microsoft Excel 97, 2000, 2002, and 2003. You can find a version of this tip for the ribbon interface of Excel (Excel 2007 and later) here: Exploded Pie Chart Sections.

Author Bio

Allen Wyatt

With more than 50 non-fiction books and numerous magazine articles to his credit, Allen Wyatt is an internationally recognized author. He is president of Sharon Parq Associates, a computer and publishing services company. ...

MORE FROM ALLEN

Renaming a Macro

Want to give your macros a different name than they currently use? There are a couple of ways you can do the renaming, as ...

Discover More

Moving the Taskbar to a Different Edge of the Screen

The Taskbar is normally displayed along the bottom edge of the screen. Windows gives you the flexibility to decide where ...

Discover More

Copying Print Areas when Copying Worksheets

Print areas are a great way to define what, exactly, you want to print from a worksheet. When you copy worksheets, the ...

Discover More

Solve Real Business Problems Master business modeling and analysis techniques with Excel and transform data into bottom-line results. This hands-on, scenario-focused guide shows you how to use the latest Excel tools to integrate data from multiple tables. Check out Microsoft Excel 2013 Data Analysis and Business Modeling today!

More ExcelTips (menu)

Modifying Axis Scale Labels

You want your chart to display information as clearly and succinctly as possible. Modifying the labels used to indicate ...

Discover More

Quickly Duplicating Drawing Objects

Excel provides a couple of different ways that you can quickly duplicate drawing objects in a worksheet. Committing these ...

Discover More

Deleting All Graphics

Graphics can really add pizzazz to a worksheet, but they can also present some drawbacks. If you want to get rid of all ...

Discover More
Subscribe

FREE SERVICE: Get tips like this every week in ExcelTips, a free productivity newsletter. Enter your address and click "Subscribe."

View most recent newsletter.

Comments

If you would like to add an image to your comment (not an avatar, but an image to help in making the point of your comment), include the characters [{fig}] (all 7 characters, in the sequence shown) in your comment text. You’ll be prompted to upload your image when you submit the comment. Maximum image size is 6Mpixels. Images larger than 600px wide or 1000px tall will be reduced. Up to three images may be included in a comment. All images are subject to review. Commenting privileges may be curtailed if inappropriate images are posted.

What is 5 - 3?

There are currently no comments for this tip. (Be the first to leave your comment—just use the simple form above!)


This Site

Got a version of Excel that uses the menu interface (Excel 97, Excel 2000, Excel 2002, or Excel 2003)? This site is for you! If you use a later version of Excel, visit our ExcelTips site focusing on the ribbon interface.

Newest Tips
Subscribe

FREE SERVICE: Get tips like this every week in ExcelTips, a free productivity newsletter. Enter your address and click "Subscribe."

(Your e-mail address is not shared with anyone, ever.)

View the most recent newsletter.