When you create a chart in Excel, the chart can be either embedded as an object within an worksheet, or you can add the chart as its own worksheet. Each type of chart has its advantages, and at some time you might want to change a particular chart from one type to the other. In order to do this, follow these steps:
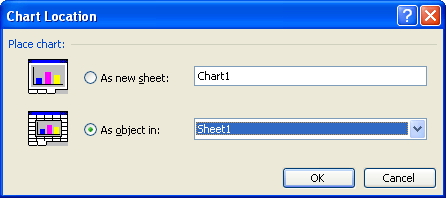
Figure 1. The Chart Location dialog box.
ExcelTips is your source for cost-effective Microsoft Excel training. This tip (3030) applies to Microsoft Excel 97, 2000, 2002, and 2003.

Excel Smarts for Beginners! Featuring the friendly and trusted For Dummies style, this popular guide shows beginners how to get up and running with Excel while also helping more experienced users get comfortable with the newest features. Check out Excel 2019 For Dummies today!
Do you use Excel's charting capabilities to display three-dimensional views of your data? The program provides a way that ...
Discover MoreGridlines are often added to charts to help improve the readability of the chart itself. Here's how you can control ...
Discover MoreFiguring out how to get the data points in an X-Y scatter plot labeled can be confusing; Excel certainly doesn't make it ...
Discover MoreFREE SERVICE: Get tips like this every week in ExcelTips, a free productivity newsletter. Enter your address and click "Subscribe."
There are currently no comments for this tip. (Be the first to leave your comment—just use the simple form above!)
Got a version of Excel that uses the menu interface (Excel 97, Excel 2000, Excel 2002, or Excel 2003)? This site is for you! If you use a later version of Excel, visit our ExcelTips site focusing on the ribbon interface.
FREE SERVICE: Get tips like this every week in ExcelTips, a free productivity newsletter. Enter your address and click "Subscribe."
Copyright © 2026 Sharon Parq Associates, Inc.
Comments